
Trading Elliott Wave
Elliott Wave Theory and Analysis
At first sight, the Elliott wave theory appears to be perfect, all you have to do is place the appropriate wave count on the chart, by obeying a few simple rules and guidelines, and then you should be able to forecast where the market will go next. However, these are carefully chosen examples, and this is where the problem normally occurs, in that most textbooks and Elliott wave courses use specially selected examples that are tailored to demonstrate the technique.
However, as we will see in the first section below, things are very different once you enter the real world.
Trading Elliott Wave – Enter the real world
Please understand that the comments in this web site are only a personal observation from my own experience, but it is one that appears to reflect many Elliott wave analysts I have met during my 35 years involved in the markets. The normal sequence of events goes something like this. Firstly, the budding Elliott wave analyst hears about Elliott waves on some chat room or from another trader, and then goes and purchases an Elliott wave book or trading course. They then spend months carefully studying all of the rules and guidelines with the aim of becoming fluent in Elliott wave analysis. They then try to apply the rules and guidelines they have learnt to real and live market examples, normally with limited success. You can always spot a new Elliott wave analyst because they always have the most current bar ending some sort of complicated wave structure, with labels of varying degree all over their chart. They then make a forecast that must be correct because everything is perfect and all the rules have been obeyed on their chart.
However, the market usually goes the other way, resulting in a trading loss. They usually try this on a number of charts over a few weeks or months, with most of the charts moving in exactly the opposite direction to anticipated. Sometimes the Elliott student will have one great success, and call the exact day of a market turn, which normally makes them deny or carefully forget more of the not-so-good recent calls on other markets. But usually, at some point, the student admits that most of their calls are not working out as anticipated.
I have seen this all too often over the last 35 years. Basically, no matter now perfect the current wave count seems, it very often break down at some point in the future. As such the current forecast you have does not work out as anticipated.
So why should the theory break down so often. From my own experience I noticed that Markets go through Cycles, they have periods of clarity, where the pattern is clear and can be used, then they also have periods of uncertainty, when the pattern is unclear. I call this the “The Cyclical Nature of Trading”. The only practical way round this is to accept that Elliott wave analysis only works about 50% of the time. In other words, an easy to recognise and obvious wave count only exists on the charts you look at or will only work about 50% of the time while you are looking at one market.
So is there an answer, and more importantly, can Elliott Wave (with all its shortfalls) be used as a successful trading approach? I am glad to say that the answer is yes, please see the next section.
Elliott Wave – Isolation Approach
In the last section we saw, that no matter how good the Elliott Wave Pattern looked at the time, more times than not it broke down and the anticipated forecast did not unfold. The reason for this was that markets tend to go in Cycles, what I call the. Cyclical nature of Markets, so any Technical Analysis approach can only be reliably used about 50% of the time, and this includes Elliott Wave Analysis. So, after a lot of research it dawned on me that trying to use Elliott Wave in the way it was traditional taught would never work because the idea of being able to make a forecast 100% of the time in a Market that was only in a clear pattern about 50% of the time was not sensible. The solution became obvious, what if I only tried to use Elliott Wave Analysis when the Market pattern was clear? This meant that Elliott Wave could only be used about 50% of the time, the other 50% of the time (when the Market Pattern was unclear) it was better doing nothing. And so my Isolation Approach to Elliott Wave Analysis was born !
For me, this made perfect sense, because as a Trader (rather than an Analysist), all we need to know is how to uncover a Trade setup, so all we needed was a unique point in time when the Market was in a position where you could enter a trade with a small control initial risk. In other words, you just needed to know the pattern at that time. Then you use correct Position Sizing (more on this in other parts of this web site) to keep the initial risk small. Then over time, if you make trades where the Profits are larger than the losses then you have the basis for a successful approach to Trading. It did not matter that about 50% if the time the market pattern was unclear, because as Traders we are not looking to know where the market is going all the time, we are just looking for Tradable opportunities when the market pattern is clear.
This then formed the basis of my unique Isolation Approach to Elliott Wave.
That is all well and good, I can hear you ask, but how do we know when to start the Elliott Wave Pattern. Again, the answer was remarkably obvious, we look to the higher time frame charts. We have all heard that it is important to make sure your analysis fits in with the higher time frame, so why not use the same approach with my Isolation Approach to Elliott Wave. Again, from my own research, I discovered areas of Support or Resistance that very often produced a turn in the market, I called these Decision Points (DP’s). As such, the best place to start a new Elliott Wave sequence was at an area of DP support / resistance on the higher time frame chart.
If any of you have studied Elliott Wave before you will know that it can become incredibly complicated with Alternate Wave counts and complex corrections. But the only reason these have been introduced is to try and cope with the times when the traditional Wave Theory breaks down. Because we are now only looking to do Analysis when the market pattern is clear, we no longer need any of these more complex or confusing parts of the traditional Elliott Wave theory. This then simplified things considerably, where we can focus on the simplest Elliott Wave Pattern of all, the ABC correction.
This was great, because the most common place an ABC correction unfolded was in the Wave (2), and what followed a Wave (2), a Wave (3), which is usually the strongest and longest swing in a completed Elliott Wave sequence. So, by simplifying the Elliott Wave Theory and only using it in Isolation (when the Market Pattern is clear) we had the potential to uncover what I (personally), think is one of the best trades you can get. Being able to enter a market as the Wave (2) is ending (with a small controlled risk) to then be able to trade what is potentially the longest swing (where the largest profit is available). In other words, the smallest initial risk for the largest Profit potential.
I hope this gives you an overview of how and (more importantly) why I developed my unique Isolation Approach to Elliott Wave. To be able to take the best (and simplest) parts of the Traditional Elliott Wave theory and then apply then into the real world where Markets go through Cycles and their pattern is only clear about 50% of the time. My unique Isolation Approach to Elliott Wave then became the basis of the MTPredictor software program that was launched in 2001.
Elliott Wave 3 trade setup
From my 34 years experience in the markets, I believe this is the best Elliott Wave setup there is. From reading the Elliott Wave Rules and Guidelines, you will have already seen that the strongest Elliott Wave is Wave (3), this is Guideline No: 1 so that is the best wave to trade. To enter at the start of the Wave (3) we need a method to enter at the end of the Wave (2). From Guideline No: 4 we have seen that Wave (2) usually unfolds as a simple ABC. So based on this, if we look to enter a new trade on the end of a Wave (2) that has just unfolded as a simple abc correction. Then we are in the best place to then trade the strong Wave (3) swing.
So what points do we need to look for ?
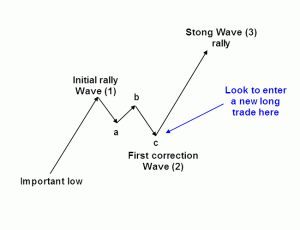
First we need to identify an important high or low. Which is usually DP Support / Resistance on the Higher time frame chart. This is the starting point. Then we need to identify the initial swing off this important high or low, this is the Wave (1). Next we look for the first correction following the initial swing after an important high or low. This is the Wave (2). This initial correction should unfold as a simple abc pattern.
Let’s see what this looks like:
For a more detailed look on a real-world example here is a short (8min) video showing this unfolding on a:
5min Chart of the DaxAs you can see, getting in at the end of the Wave (2), ie the start of the Wave (3), then allows you to keep your initial risk small. To then take full advantage of the Strong Wave (3) swing as it unfolds. Now you can see why this is my favourite setup. Not because it has a high % of winners, but because it has the potential for Profits that are much larger than the initial risk.